Views: 0 Author: Site Editor Publish Time: 2026-07-09 Origin: Site

A common discrepancy exists between a wind turbine’s advertised nameplate capacity and its actual real-world energy generation. Facility managers, developers, and property owners often miscalculate return on investment because they rely on peak power ratings rather than analyzing how the turbine performs across their site's specific wind speed distribution. A 10kW turbine rarely operates at 10kW continuously. Understanding this gap is necessary for accurate energy planning and system sizing.
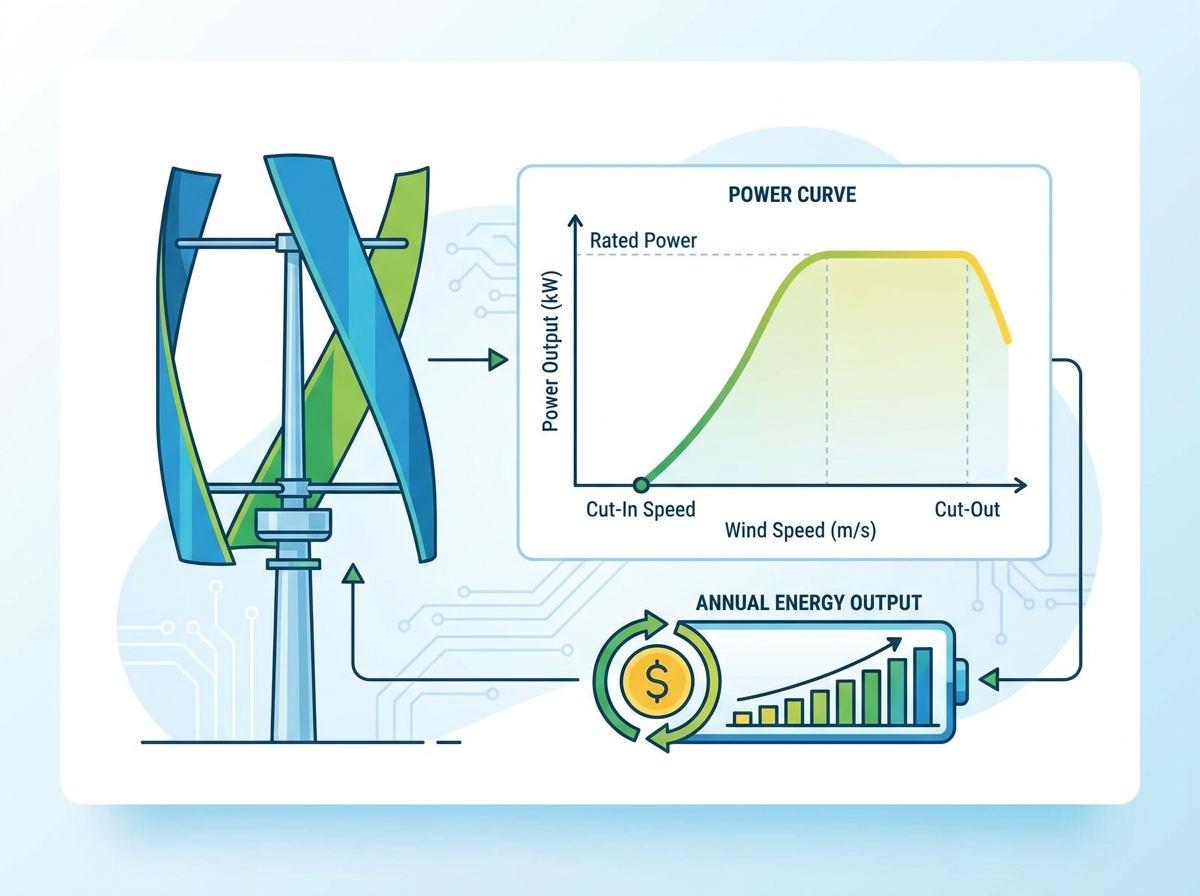
Decoding the power curve—specifically the interplay between cut-in speed, rated power, and cut-out speed—is the only reliable method to validate a vertical axis wind turbine for commercial or residential deployment. Relying on single-number metrics leads to undersized battery banks, unmet load requirements, and failed projects. This article breaks down the mechanics of power curves, compares rotor designs, and provides actionable steps to calculate true annual energy output based on field-tested methodologies.
Nameplate Capacity is Secondary: A turbine’s rated power is less critical to ROI than its performance at the average wind speeds specific to your site.
Design Dictates the Curve: Drag-based (Savonius) and lift-based (Darrieus) vertical axis wind turbines exhibit fundamentally different power curves, impacting their suitability for low-wind vs. high-wind environments.
Site Data is Mandatory: Accurate Annual Energy Output (AEO) calculations require mapping the manufacturer's power curve against a site-specific wind frequency distribution (Weibull curve).
Verification Mitigates Risk: Independent, third-party performance evaluations are necessary to filter out exaggerated manufacturer claims regarding cut-in speeds and peak efficiencies.
Buyers need a standardized framework to evaluate how a turbine translates kinetic wind energy into electrical output across varying conditions. A power curve provides this exact framework, illustrating performance limits, generation thresholds, and aerodynamic efficiency at every operational wind speed. Without a verified power curve, predicting energy yield is entirely guesswork.
Demystifying the visualization requires looking at the axes. The X-axis maps Wind Speed, typically measured in meters per second (m/s) or miles per hour (mph). The Y-axis represents Power Output, usually in Watts (W) or Kilowatts (kW). Plotting these points identifies the turbine's operational envelope, showing exactly how much power is generated at any given wind velocity. Field engineers use this curve to match the turbine's sweet spot with the site's most frequent wind speeds.
To illustrate, consider a standard power curve dataset for a mid-sized vertical turbine. The table below demonstrates how power output scales non-linearly with wind speed until it hits the rated capacity.
Wind Speed (m/s) | Operational State | Power Output (Watts) |
|---|---|---|
0 - 2.5 | Below Cut-In (No Generation) | 0 |
3.0 | Cut-In Speed Reached | 150 |
5.0 | Ramping Up | 800 |
8.0 | High Efficiency Zone | 2,400 |
11.0 | Rated Wind Speed | 5,000 |
14.0 | Governing / Plateau | 5,000 |
18.0+ | Cut-Out (Braking Engaged) | 0 |
Cut-in speed is the exact velocity where the turbine overcomes mechanical friction and aerodynamic drag to begin generating usable electrical power. Mechanical friction primarily comes from the main shaft bearings and the cogging torque of the permanent magnet synchronous generator (PMSG). Lower cut-in speeds are critical for urban or turbulent environments with inconsistent wind flows, allowing the system to capture energy during frequent low-wind periods.
It is important to differentiate between the cut-in wind speed and the lower "start-up" wind speed. Start-up speed is when the rotor begins to spin, but it does not produce usable power until it reaches the cut-in threshold. A turbine spinning slowly in a 2 m/s breeze might look impressive, but if the cut-in speed is 3.5 m/s, zero watts are flowing to the charge controller.
Rated wind speed marks the point where the turbine achieves its maximum advertised power output, often referred to as the nameplate capacity. Once this speed is reached, the power curve typically flattens out. The generator and inverter are physically capped at this limit to prevent overheating and electrical failure.
Avoid the procurement trap of buying based solely on high rated power. If a turbine requires a rated wind speed of 14 m/s to hit its peak output, but your installation site averages 6 m/s, you will never realize that advertised capacity. You are paying for heavy-duty copper windings and large inverters that will remain underutilized for the lifespan of the hardware.
The physical height and diameter of a rotor define its swept area. For H-rotors, this is calculated simply as height multiplied by diameter. Swept area directly scales the power curve, setting the physical upper limit on kinetic energy capture before any mechanical or aerodynamic efficiency losses are factored in. A larger swept area captures more wind, shifting the entire power curve upward.
You cannot cheat physics. If a manufacturer claims a 10kW output from a rotor with a swept area of only 3 square meters, the claim is mathematically impossible based on the density of air and the Betz limit. Evaluating swept area provides a quick reality check against exaggerated marketing brochures.
Cut-out speed is the velocity at which braking systems engage to stop the rotor. This prevents catastrophic structural or electrical failure during extreme weather. Braking mechanisms usually include dynamic braking resistors (dump loads) that electrically stall the generator, backed up by mechanical disc brakes for redundant safety.
Survival wind speed ratings dictate the absolute maximum wind force the stationary turbine can withstand without breaking. This metric is vital for installations in hurricane-prone or high-gust regions. A robust survival rating requires heavy-duty guy wires, reinforced foundation mounts, and high-tensile steel or carbon fiber blade struts.
Understanding the two primary architectures helps clarify how aerodynamic principles shape their respective power curves. Rotor design dictates whether a turbine is suited for low-speed torque or high-speed efficiency. You must match the rotor type to the specific wind regime of your site.
Savonius rotors operate on drag, pushing against the wind like a sail. This creates a high-torque, low-speed operational profile. Power curve traits for Savonius designs include lower cut-in speeds and excellent self-starting capabilities. They begin rotating in very light breezes without external assistance.
However, they experience a rapid plateau in power output and have lower overall aerodynamic efficiency. The inherent drag on the returning blade (the side moving against the wind) limits their maximum rotational speed. Savonius turbines rarely exceed a Tip Speed Ratio (TSR) of 1.0, meaning the blade tip moves at the exact speed of the wind.
Ideal for highly turbulent, ground-level urban environments.
Excellent for off-grid telecom towers requiring reliable trickle charging.
Preferred when mechanical simplicity and low maintenance outweigh peak energy yield.
Suitable for extreme cold climates where ice buildup might stall lift-based airfoils.
Darrieus rotors, including H-rotor and helical variants, utilize airfoil shapes to generate lift, resulting in high-speed rotation. Their power curves show higher peak efficiencies and greater energy yield at higher wind speeds. A well-designed Darrieus turbine can achieve a TSR of 3.0 to 4.0, allowing the blades to spin much faster than the ambient wind speed.
The trade-off is poor self-starting capability. The airfoils cannot generate sufficient lift from a standstill. They often require external motors, hybrid designs (incorporating a small Savonius rotor inside the Darrieus blades), or higher cut-in speeds to initiate rotation before lift forces take over. Once spinning, however, their power curve climbs steeply, making them far superior for bulk energy generation in open, high-wind areas.
Transitioning from theoretical turbine metrics to calculating actual financial and energy returns requires site-specific data. The power curve alone does not tell you how much energy you will generate over a year. You must combine the turbine's capabilities with the site's meteorological realities.
To calculate Annual Energy Output (AEO), you must overlay the turbine's power curve onto a Weibull wind speed distribution chart for your specific geographic location. The Weibull curve is a probability density function that shows the frequency of different wind speeds at your site. It relies on two parameters: the shape factor (k), which indicates wind speed variance, and the scale factor (c), which relates to the average wind speed.
By multiplying the hours spent at each wind speed by the power output at that speed, you determine the total energy yield. For example, if your site experiences 6 m/s winds for 1,200 hours a year, and the turbine generates 1kW at 6 m/s, that specific wind bin contributes 1,200 kWh to your annual total. You repeat this calculation for every wind speed bin to find the final AEO.
Relying solely on annual average wind speeds can severely skew ROI projections. Wind is rarely consistent year-round. A site might average 6 m/s annually, but experience 9 m/s averages in winter and 3 m/s averages in summer. If your facility requires heavy air conditioning loads in the summer, a wind turbine alone will fail to meet that seasonal demand.
Generating monthly or seasonal power curves helps assess performance across differing seasonal wind regimes. This allows you to align projected energy production with seasonal energy demand. Field engineers use this seasonal data to size hybrid systems, pairing the wind turbine with solar arrays that peak during the low-wind summer months.
Vertical axis designs handle omnidirectional and turbulent winds better than traditional turbines. They do not need to yaw (turn) to face the wind, allowing them to capture energy from rapidly shifting gusts. This advantage often reflects in higher actual yields in urban environments compared to theoretical power curves derived from smooth laminar flow testing.
Always use hub-height anemometer data rather than regional airport weather data for accurate AEO modeling. Airport data is measured at 10 meters in wide-open fields. If you are installing a turbine on a 5-story commercial building surrounded by other structures, the wind shear and turbulence will drastically alter the wind profile. Installing a data-logging anemometer at the exact planned mounting location for at least 90 days is the only way to secure reliable wind data.
Contextualizing performance against industry-standard Horizontal Axis Wind Turbines (HAWTs) provides a clearer picture of overall value and application suitability. Each design serves different operational requirements and site constraints.
HAWTs generally possess superior power curves and higher overall efficiency, often approaching 40-50% aerodynamic efficiency per square meter of swept area. They capture more energy in smooth, laminar wind flows. However, HAWTs suffer from "yaw lag" when wind directions shift quickly. The turbine must physically rotate to face the new wind direction, losing generation time and shedding aerodynamic efficiency during the transition.
Vertical designs generate power continuously regardless of wind direction, preventing these yaw lag losses. In highly turbulent environments like rooftops, mountain ridges, or urban canyons, a vertical turbine will often outperform a horizontal turbine of the same swept area simply because it never stops generating during rapid wind shifts.
In many scenarios, lower peak efficiency is an acceptable trade-off. A vertical turbine's lower acoustic profile and smaller spatial footprint often justify its use over a HAWT. Horizontal turbines generate significant tip-vortex noise, creating a rhythmic "whoosh" that violates residential noise ordinances. Vertical turbines operate at lower tip speed ratios, drastically reducing aerodynamic noise.
Furthermore, zoning boards frequently reject horizontal turbines due to visual impact and blade-throw risks. Vertical turbines present a more compact, visually contained profile that is easier to permit in densely populated areas. When evaluating the power curve, you must factor in these permitting realities; a highly efficient HAWT generates zero power if the city refuses to issue a building permit.
Protecting your investment requires identifying common pitfalls in the small and medium wind turbine market. Manufacturer claims must be scrutinized against physical laws and independent testing. The industry is unfortunately plagued by exaggerated marketing materials.
Spotting unrealistic power curves is essential. Be wary of curves that defy the Betz limit of 59.3% aerodynamic efficiency or claim massive output at improbably low wind speeds. If a manufacturer claims a 5kW output at 5 m/s from a rotor that is only 2 meters tall and 2 meters wide, the math is fraudulent.
Always request third-party certification, such as SWCC (Small Wind Certification Council) or IEC 61400 standards, before finalizing procurement. Verified data is the only reliable basis for ROI calculations. If a manufacturer refuses to provide raw power curve data or independent test reports, disqualify them immediately. If you need assistance verifying specifications, you can contact us for an independent review of the proposed hardware.
The cyclical aerodynamic loading inherent in vertical axis operation impacts long-term mechanical reliability. Blades experience alternating forces during every rotation—moving into the wind, across the wind, and retreating from the wind. This creates continuous flexing and stress on the blade struts and main shaft.
Power degradation over time due to wear on bearings and generators must be factored into the lifecycle AEO and ROI calculations. Tapered roller bearings will eventually wear down, increasing mechanical friction and raising the cut-in speed. Regular maintenance schedules, including bearing lubrication, bolt torque checks, and blade inspections, are critical to sustaining the power curve over the turbine's lifespan.
A vertical axis wind turbine is only a viable investment when its specific power curve aligns with the verified wind profile of the installation site. Prioritize Savonius designs for low-wind or high-turbulence environments where reliability and self-starting are key. Choose Darrieus designs for higher-wind sites requiring greater energy yield, provided the self-starting issues are adequately mitigated through hybrid designs or motor assistance.
Next steps for implementation include:
Install a data-logging anemometer at the exact intended hub height to capture site-specific wind speeds and turbulence intensity for a minimum of 90 days.
Request raw, unadjusted power curve data and third-party certification reports from shortlisted manufacturers.
Perform independent AEO modeling by overlaying the verified power curve onto your site's specific Weibull distribution data.
Calculate seasonal energy yields to ensure the turbine's output aligns with your facility's peak energy demand months.
Establish a preventative maintenance schedule focusing on bearing lubrication and strut torque to prevent power curve degradation over time.
A: A good cut-in speed typically ranges between 2 to 3 meters per second (4.5 to 6.7 mph). Lower cut-in speeds allow the turbine to start generating power earlier, which is highly advantageous in urban or low-wind environments where high-velocity gusts are rare.
A: Calculate AEO by multiplying the power output at each wind speed (from the manufacturer's power curve) by the number of hours your site experiences that specific wind speed annually. This hour data is derived from a site-specific Weibull distribution chart.
A: They generally have lower efficiency because, during rotation, some blades move against the wind, creating drag. Additionally, they often operate closer to the ground where wind speeds are lower and more turbulent compared to the higher elevations utilized by horizontal turbines.
A: When wind speeds exceed the cut-out limit, the turbine's braking system engages. This typically involves dynamic electrical braking followed by mechanical disc brakes. This stops the rotor from spinning to prevent mechanical damage, structural failure, or generator burnout.
A: No, Savonius turbines are drag-based and possess excellent self-starting capabilities. They typically have very low cut-in speeds, allowing them to begin rotating and generating power in light breezes without the need for external starter motors.
A: Swept area determines the total amount of wind energy the turbine can intercept. A larger swept area captures more kinetic energy, which shifts the entire power curve upward, resulting in higher potential power output at all operational wind speeds.